Microsoft adds Python to Excel

Microsoft announced today that it is integrating the Python programming language into its ubiquitous Excel spreadsheet software. The public preview of this feature is available today for Microsoft 365 Insiders in the Beta Channel, initially limited to Windows users.
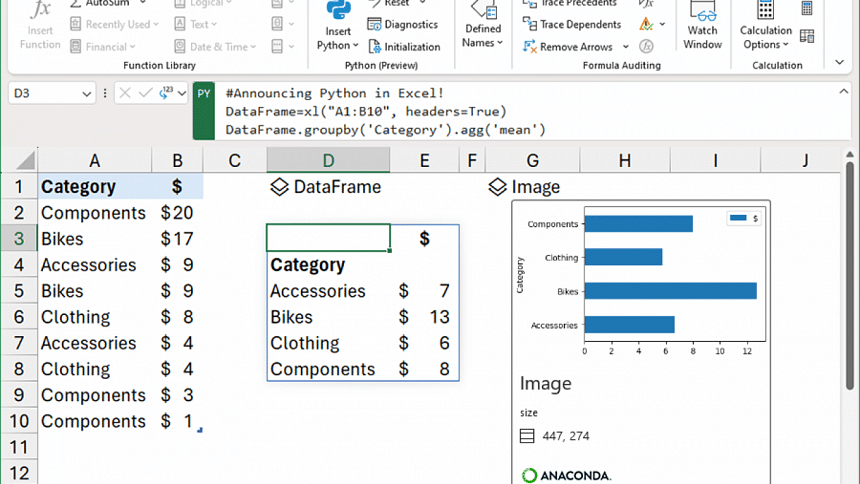
The integration will not require any additional software installations or add-ons. Python will be woven into Excel's built-in connectors and Power Query. Microsoft is also introducing a new PY function that will allow Python data to be displayed within the grid of an Excel spreadsheet.

In collaboration with Anaconda, an enterprise Python repository, Microsoft is making popular Python libraries like pandas, statsmodels, and Matplotlib available within Excel. This partnership aims to bring the power of Python's data manipulation and statistical modeling capabilities directly to Excel users, who number in the hundreds of millions globally.
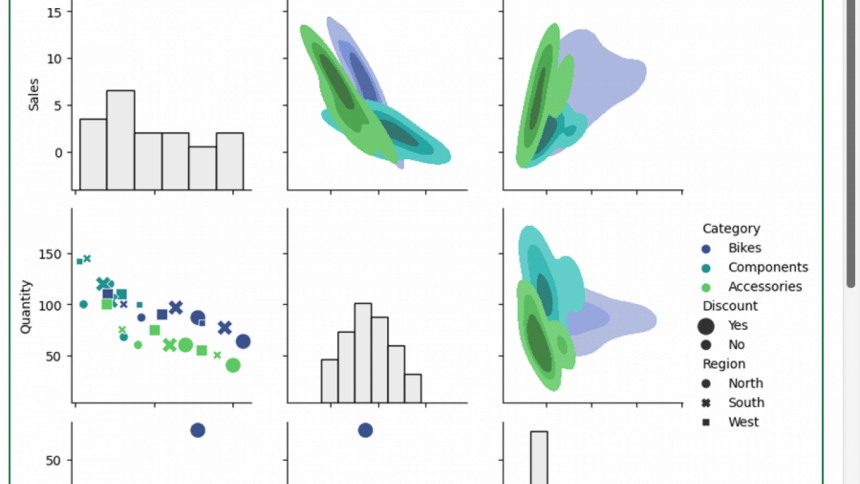
Python calculations will run in the Microsoft Cloud, with the results returned directly into an Excel worksheet. This enables Excel users to create complex formulas, PivotTables, and charts based on Python data. The integration also supports charting libraries like Matplotlib and Seaborn, opening the door for advanced visualisations such as heatmaps, violin plots, and swarm plots.

While Python in Excel will be included in a Microsoft 365 subscription during the public preview, Microsoft has indicated that "some functionality will be restricted without a paid license" after the preview period ends.
Microsoft plans to extend this feature to other platforms "at a later date," but for now, the focus is on refining the experience for Windows users. As the lines between traditional spreadsheet manipulation and data science continue to blur, Microsoft's Python-Excel integration marks a significant step toward a more unified, powerful tool for data analysis.
For Excel users and Python enthusiasts alike, the future just became a little more integrated.

 For all latest news, follow The Daily Star's Google News channel.


Comments